Andy has left a nice comment on my previous post – Andy wants to beat the bank rate!
Actually, that is one of the very good targets to achieve. People have different targets – some like Mutual Fund mangers go after the market index they are tracking, and they attempt to beat it. Some traders try to beat the bank Fixed deposit rate (as Andy is attempting to do), some have individual targets fixed for themselves, depending upon what they want to achieve, and the rest just don’t know what to do. Unfortunately, majority of us fall in the last category – we just don’t know how much we want to achieve and in how long horizon.
In stocks trading business of selling and buying stocks, one of the things that’s always good to achieve is to have knowledge about what you want and in what time period. If we have certainty in our ambitions, then 50% of our work is done. If we don’t have any certainty in what we want to achieve, we are already half way defeated. It’s easy to see our stock price going up by 50%, but having no target in mind means we have no clue about how long should I wait for and how much return can I expect from this stock. Even if we have that in our minds, we cannot be sure when this target will be achieved.
Anyways, traders are traders. It is commonly observed that people get fascinated about the rise they see in the stocks they are holding, they keep on holding the stock for long but uncertain time – just to observe that one fine day their rising stocks have taken a U-turn and started going down. They get fascinated with their holdings, build up strong belief that the stock would once again rise and hold it. Ultimately, no one has any clue on what they want to achieve.
As stated earlier, half the problem is solved if we get out of our stock holding fantasies and affections that we develop with our holding shares. If you are a long term investor, define to yourself what long term is. If you are a short term trader, decide what short term for you is. Nobody other than you can help you!
Andy has raised a valid point and I would say it is a very good strategy for any trader to have an aim to beat the bank rate in a year. The reason – banks rates are, generally, always positive, while the return from equities or stock trading, even index based ETF may turn out to be negative. Hence, suppose in the next year the index like Nifty goes down by 20%, then your ETF investment will also go down by 20% or so. However, if you manage to keep up your trading activities and follow you goals religiously to beat the bank rate of 10%, then you will be outperforming the markets by 30%. Even fund managers fail to do so, traders aspire to do so consistently – some fail, some succeed.
On the other side, instead of going down, if the markets go up by 20% and you are still with a little more than 10% of your returns beating the bank rate, then you will fall much behind the market.
Continue to Part II of this article
Showing posts with label Trading Tips. Show all posts
Showing posts with label Trading Tips. Show all posts
Monday, 7 January 2008


Stock Market Trading Strategies-2
This is part II of the article: Stock Market Trading Strategies-I, please read the first part before proceeding with this part:
Ultimately, it depends upon your psychological biases and targets that you set with the level of certainty. As I’ve explained in my previous post Forex currency trading and Hedging strategies, that hedging is used for eliminating the risk and to achieve a certainty in the future prices. So if you loose on a significant bull run while you are in a hedged position, you should not repent because your purpose for hedging was to eliminate the risk and achieve the desired level of certainity in your profits.
Same thing goes here as well. If you are happy by beating the bank rate, don’t repent on loosing on a 50% bull run in the market.
One more thing to notice is that you should know how to calculate the profits. That includes deducting the brokerage charges, demat charges, internet charges (if you pay for it), phone calls (if trading by call-n-trade) and basically anything that accrues a cost for your trading activities.
Another aspect of looking at this strategy is effort v/s reward. Is beating the bank rate justified for the amount of time, effort and energy you put in?
We should not forget that the bank rate that we get is effortless and with 100% certainity. You just walk into a bank branch, put in your money with a particular saving scheme in a bank account and walk away without any worries. You come back on the maturity date and happily take away your money plus the interest or return that you’ve earned. Simple and Straightforward.
But is it same for trading stocks with having an aim of beating the bank rate? One cannot quantify the effort you put in stock picking skills, the time you invest in researching the stocks, or refreshing the stock prices webpage for trading on a daily basis. It is difficult to keep track of internet usage or telephone bills. We tend to forget the demat charges and brokerage fee – even if we do so, we do not usually take the time value of discounted cash flows.
Ultimately, this is the randomness that one trader has to fight against. No one can have any control on which way the market goes, which way the stock prices move and how much you can make from your stock picks. Remember that it is not possible to quantify the efforts that you put in while trading, leave apart the brokerage and other charges. No point in beating the bank rate by a mere 1% or 2%; one just has to be lucky to make a significantly high profit than that offered by the bank.
Ultimately, it depends upon your psychological biases and targets that you set with the level of certainty. As I’ve explained in my previous post Forex currency trading and Hedging strategies, that hedging is used for eliminating the risk and to achieve a certainty in the future prices. So if you loose on a significant bull run while you are in a hedged position, you should not repent because your purpose for hedging was to eliminate the risk and achieve the desired level of certainity in your profits.
Same thing goes here as well. If you are happy by beating the bank rate, don’t repent on loosing on a 50% bull run in the market.
One more thing to notice is that you should know how to calculate the profits. That includes deducting the brokerage charges, demat charges, internet charges (if you pay for it), phone calls (if trading by call-n-trade) and basically anything that accrues a cost for your trading activities.
Another aspect of looking at this strategy is effort v/s reward. Is beating the bank rate justified for the amount of time, effort and energy you put in?
We should not forget that the bank rate that we get is effortless and with 100% certainity. You just walk into a bank branch, put in your money with a particular saving scheme in a bank account and walk away without any worries. You come back on the maturity date and happily take away your money plus the interest or return that you’ve earned. Simple and Straightforward.
But is it same for trading stocks with having an aim of beating the bank rate? One cannot quantify the effort you put in stock picking skills, the time you invest in researching the stocks, or refreshing the stock prices webpage for trading on a daily basis. It is difficult to keep track of internet usage or telephone bills. We tend to forget the demat charges and brokerage fee – even if we do so, we do not usually take the time value of discounted cash flows.
Ultimately, this is the randomness that one trader has to fight against. No one can have any control on which way the market goes, which way the stock prices move and how much you can make from your stock picks. Remember that it is not possible to quantify the efforts that you put in while trading, leave apart the brokerage and other charges. No point in beating the bank rate by a mere 1% or 2%; one just has to be lucky to make a significantly high profit than that offered by the bank.
Thursday, 20 December 2007
Weekend Effect on Stock Prices - 2
Continuing further from the first part of this article on Weekend Effect on Stock Prices, here is the second part:
However, the weekend effect has been prominent only in the US & UK stock market along with Japan, while it is completely absent in the other stock markets like Singapore, Malaysia and Philippines.

The case of Japan is an interesting one, because Japan allows Saturday trading during the period of observation of this stock market data. The presence of a strong weekend effect in Japan, which allowed Saturday trading for a portion of the period studies here indicates that there might be a more direct reason for negative returns on Mondays than bad information over the weekend.
Here is something more interesting:
The negative returns on Mondays cannot be justified for a reason of the absence of trading over the weekend. The returns on days following trading holidays, in general, are characterized by positive, not negative, returns – which is completely contradictory to what we observe in case of Monday effect.
Here is a graph showing the returns following the holidays in US – where the weekend effect has been most prominent:

As we can observe from the graph above, the holiday effect has been prominent for positive returns in case of most of the US holidays – except for American Independence day (4th July). The return on 5th July is negative, but still very low compared to the positives that we observe on other days following holidays.
So what can be concluded from these findings and observations?
I really don’t know. The data that is used in the above studies dates back to 1927.
However, the weekend effect has been prominent only in the US & UK stock market along with Japan, while it is completely absent in the other stock markets like Singapore, Malaysia and Philippines.

The case of Japan is an interesting one, because Japan allows Saturday trading during the period of observation of this stock market data. The presence of a strong weekend effect in Japan, which allowed Saturday trading for a portion of the period studies here indicates that there might be a more direct reason for negative returns on Mondays than bad information over the weekend.
Here is something more interesting:
The negative returns on Mondays cannot be justified for a reason of the absence of trading over the weekend. The returns on days following trading holidays, in general, are characterized by positive, not negative, returns – which is completely contradictory to what we observe in case of Monday effect.
Here is a graph showing the returns following the holidays in US – where the weekend effect has been most prominent:

As we can observe from the graph above, the holiday effect has been prominent for positive returns in case of most of the US holidays – except for American Independence day (4th July). The return on 5th July is negative, but still very low compared to the positives that we observe on other days following holidays.
So what can be concluded from these findings and observations?
I really don’t know. The data that is used in the above studies dates back to 1927.
| What has happened in the past may not repeat in future. What has happened in USA may not happen in other countries of the world. Give it a shot – offcourse with your luck. And hope to be lucky! :- ) | Table of Contents |
Wednesday, 19 December 2007
Weekend Effect on Stock Prices
-- Along with the January effect on the stock prices, there is another effect that has persisted over long periods and over a number of international markets – called the weekend effect.
It attributes to the differences in returns between Mondays and other days of the week.
-- Over the years of observation of stock market data, returns on Mondays have been consistently lower than returns on other days of the week.
This is also termed as the “Monday effect on stock prices”
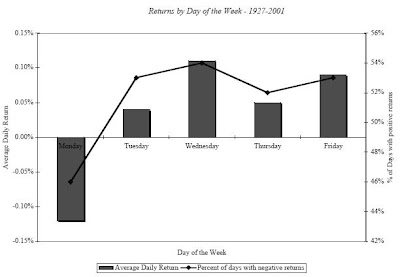
Reasons for The Weekend Effect:
The Monday effect is really called a weekend effect since the bulk of the negative returns is compensated in the Friday close to Monday open returns. The returns from intraday returns on Monday are not the actual reasons in giving away the negative returns.
The Monday effect is far more prominent small stocks than for larger stocks.
The Monday effect is eqully worse following three-day weekends than two-day weekends.
There are some other reasoning like arguments that the weekend effect is the result of bad news being revealed after the close of trading on Friday and during the weekend. Even if this were a commonly observed case, the return behavior would be inconsistent with a rational market,
It attributes to the differences in returns between Mondays and other days of the week.
-- Over the years of observation of stock market data, returns on Mondays have been consistently lower than returns on other days of the week.
This is also termed as the “Monday effect on stock prices”

Reasons for The Weekend Effect:
The Monday effect is really called a weekend effect since the bulk of the negative returns is compensated in the Friday close to Monday open returns. The returns from intraday returns on Monday are not the actual reasons in giving away the negative returns.
The Monday effect is far more prominent small stocks than for larger stocks.
The Monday effect is eqully worse following three-day weekends than two-day weekends.
There are some other reasoning like arguments that the weekend effect is the result of bad news being revealed after the close of trading on Friday and during the weekend. Even if this were a commonly observed case, the return behavior would be inconsistent with a rational market,
| since rational investors would build in the expectation of the bad news over the weekend into the price before the weekend, leading to an elimination of the weekend effect. However, this effect can still be observed. In the next article, let us discuss about the weekend effect in international markets | Table of Contents |
Monday, 17 December 2007
Stock Prices: January Effect on Stock Prices
Continuing further from the first part of this article on January Effect on Stock Prices, here is the second part:
A number of detailed explanations have been suggested for the observed January effect,
but few only the following give a reasonable justification:
Taxes are the biggest concern for traders and investors across the world.
In the US, December is end of tax-year. Hence, at the end of the tax-year, there is wide spread selling of the stocks which have 'lost money' to capture the capital gain, driving down the prices, presumably below true value, in December, and a buying back of the same stocks in January, resulting in the high returns.
Then, there is also a “wash sales rules” which prevents an investor from selling and buying back the same stock within 45 days, and there has to be some substitution among the stocks.
Thus investor X sells stock A and investor Y sells stock B, but when it comes time to buy back the stock, investor X buys stock B and investor Y buys stock A.
It will be interesting to note the same effect happening in the month of March to April for countries like India, where the financial year ends in the month of March. Moreover, there is no such rule like “Wash Sales Rule” in India, so traders can keep on betting on the same stocks again and again.
• A second reasoning is that the January effect is related to institutional trading behavior around the turn of the years. It has been noted, for example, that ratio of buys to sells for institutions drops significantly below average in the days before the turn of the year and picks to above average in the months that follow. However, once again to repeat, it has only been observed historically. There is no guarantee that the same will continue further.
• A third and very important Behavioural Aspect that has been observed is due to Christmas and Holiday Season. Since it is festival and holiday time in the US (and other western countries), people need money for spending – either for buying gifts for their loved ones, making new purchases for self and family, or for going on enjoying the holidays. All this results in huge spending and the investors usually try to take the money out of their investments. Hence there is wide spread selling. This again causes stock prices to tumble just before festive season, i.e. early and mid-December. The same investors will again come back in January for putting in fresh money and starting again, hence the January effect predominates.
Not only for USA, the January effect is prominent for other countries as well. Here is the graph showing the historical returns in the month of January as compared to other months for different countries across the globe.

However, all the observation and data dates back to 1927 and is primarily concerned with USA stock markets. It forms an interesting case for other countries like India because firstly, the Indian financial year is different from the US financial year and secondly, the festive season is in October-November (Diwali/Dusshera). So things may be different for stock markets like India.
A number of detailed explanations have been suggested for the observed January effect,
but few only the following give a reasonable justification:
• Tax loss selling by investors
Taxes are the biggest concern for traders and investors across the world.
In the US, December is end of tax-year. Hence, at the end of the tax-year, there is wide spread selling of the stocks which have 'lost money' to capture the capital gain, driving down the prices, presumably below true value, in December, and a buying back of the same stocks in January, resulting in the high returns.
Then, there is also a “wash sales rules” which prevents an investor from selling and buying back the same stock within 45 days, and there has to be some substitution among the stocks.
Thus investor X sells stock A and investor Y sells stock B, but when it comes time to buy back the stock, investor X buys stock B and investor Y buys stock A.
It will be interesting to note the same effect happening in the month of March to April for countries like India, where the financial year ends in the month of March. Moreover, there is no such rule like “Wash Sales Rule” in India, so traders can keep on betting on the same stocks again and again.
• A second reasoning is that the January effect is related to institutional trading behavior around the turn of the years. It has been noted, for example, that ratio of buys to sells for institutions drops significantly below average in the days before the turn of the year and picks to above average in the months that follow. However, once again to repeat, it has only been observed historically. There is no guarantee that the same will continue further.
• A third and very important Behavioural Aspect that has been observed is due to Christmas and Holiday Season. Since it is festival and holiday time in the US (and other western countries), people need money for spending – either for buying gifts for their loved ones, making new purchases for self and family, or for going on enjoying the holidays. All this results in huge spending and the investors usually try to take the money out of their investments. Hence there is wide spread selling. This again causes stock prices to tumble just before festive season, i.e. early and mid-December. The same investors will again come back in January for putting in fresh money and starting again, hence the January effect predominates.
Not only for USA, the January effect is prominent for other countries as well. Here is the graph showing the historical returns in the month of January as compared to other months for different countries across the globe.

However, all the observation and data dates back to 1927 and is primarily concerned with USA stock markets. It forms an interesting case for other countries like India because firstly, the Indian financial year is different from the US financial year and secondly, the festive season is in October-November (Diwali/Dusshera). So things may be different for stock markets like India.
| However, the Indian stock markets are still dominated by FII and other foreign investments, so this effect can be seen in India too. We are about to enter January, so one may try his luck if he or she wishes - off course at his own risk ! :-) | Table of Contents |
Friday, 14 December 2007
Seasonal Effects on Stock Prices:January Effect

Here is something that might be of great interest to the traders and market-makers who trade on intra-day or weekly basis:
Empirical studies suggest that a variety of seasonal and temporary effects can be observed in the behaviour and movement of stock prices. Among them, the primary ones are:
• The January Effect: Stocks, on average, tend to do much better in January than in any other month of the year.
• The Weekend Effect: Stocks, on average, seem to do much worse on Mondays than on any other day of the week.
• The Mid-day Swoon: Stocks, on average, tend to do much worse in the middle of the trading day than at the beginning and end of the day.
One thing should be noted very well that while these empirical effects are only historical, they atleast provide some basis for traders, However, it is not at all certain whether any of them can be used with 100% accuracy to generate excess profit from stock trading.
In this article, I’ll concentrate only on the January effect and in the later articles, I’ll cover the remaining.
The January Effect in Stock Prices
• Studies of returns in the United States and other major financial stock markets have revealed strong signals in return behavior during different months of the year.
• As observed, Returns in January are significantly higher than returns in any other month of the year. This phenomenon is called the year-end or January effect and it can be traced to the first two weeks in January.
Another interesting observation is that the January effect is found to be much more prominent for small cap stocks or small firms than for larger firms.
As can be observed from the graph of the figure above, the monthly returns in the month of January have been significantly higher. However, the data used dates back to 1927 and hence conclusion can be drawn from the above chart for trading only based upon your risk taking responsibility.
In the next article, let's discuss about the explanations, reasoning and whether and how to benefit from such an effect. | Table of Contents |
Subscribe to:
Posts (Atom)